Flurry of Metrics Show Signs of Potential Recovery for ETH
Is the worst over for ETH?
The Ethereum markets are giving mixed signals, with on-chain data indicating accumulation is underway in spite of bearish price action.
The price of Ether slumped 6% overnight, erasing the gains posted during last week’s bounce from its seven-month low of $1,700. ETH has now dropped 63% from its November high of nearly $4,900.
The pull-back follows a record streak of eight consecutive weekly red candles for Ethereum, with further drawdowns threatening to bring the total to nine.
ETH/USD Source: TradingView
But some investors are accumulating ETH in spite of the brutal bear trend.
On-chain data from Glassnode shows that some market participants are steadily increasing the size of their ETH bags, with the number of wallets holding at least 32 ETH or 100 ETH currently at their highest levels in more than 12 months.
The sum of wallets containing more than 10 ETH is testing its all-time high posted in November 2020, while wallets holding more than 1 ETH are at record levels with 1.47M.
25-Month Low
The percent of Ethereum’s supply that is “in profit,” meaning it last moved on-chain when ETH was trading at a lower price, is at a 25-month low. The percent of Ethereum wallets in profit is similarly at a 22-month low, while the number of addresses that are at a loss based on a seven-day moving average has tagged a record high of roughly 35.17M.
Despite persistent progress towards the Eth2 chain-merge and the network’s transition to Proof-of-Stake, Ether is trading at its lowest level against BTC since October last year.
ETH/BTC Source: TradingView
Another key metric hinting at Ether’s direction is the supply locked in smart contracts. It has remained steady despite the value locked in Ethereum’s DeFi ecosystem plummeting by $40B in May and $92B since December, according to DeFi Llama. More Ether remains locked in DeFi smart contracts than on centralized exchanges, which hold roughly 17% of the circulating ETH supply.
A Reversal
Stakers also remain undeterred, with an all-time high of more than 12.7M Ether or 10.5% of ETH’s supply locked up on the Eth2 Beacon Chain. Ethereum ranks as the largest Proof of Stake network by staked capitalization with $23.1B, beating out Cardano by 9.4B according to StakingRewards.
Some metrics suggest a reversal of some kind may be coming soon.
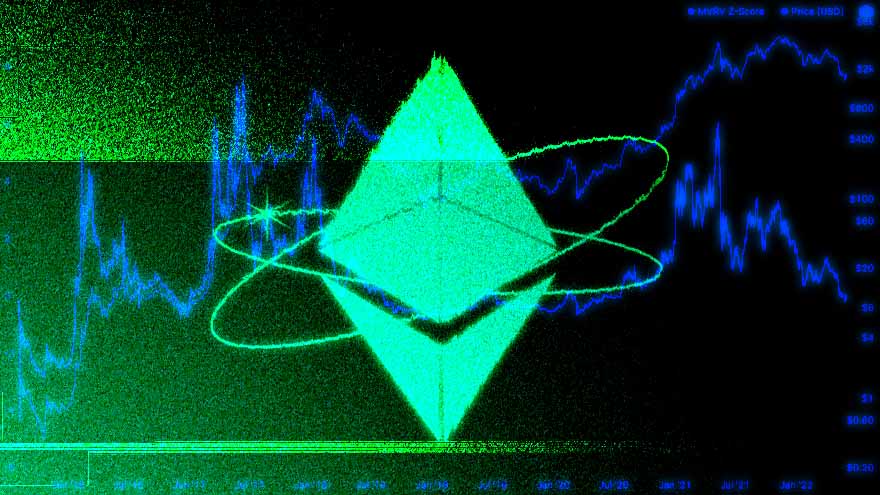
Glassnode’s MVRV Z-Score, which is used to “assess when Ethereum is over/undervalued,” is currently in its lower green band. While Glassnode says the indicator has typically indicated market bottoms, the indicator trended within the green range for nearly two years between from 2018 through 2020.
ETH MVRV Z-Score Source: Glassnode
Ethereum’s weekly relative strength indicator (RSI) is also trending at its lowest level since December 2018.
ETH Weekly RSI Source: TradingView
Advertisement
Get an edge in Crypto with our free daily newsletter
Know what matters in Crypto and Web3 with The Defiant Daily newsletter, Mon to Fri
90k+ Defiers informed every day. Unsubscribe anytime.