Bitcoin, Ethereum Stage Relief Rally Ahead of U.S. Economic Data

Crypto markets recovered on Tuesday, with Bitcoin edging closer to the $67,000 mark amidst growing concerns about a possible deeper correction.
Ethereum, the world’s second-largest cryptocurrency, was up 1.4% and hovered steadily around $3,200 at noon EST. Bitcoin was up by 0.7% to $66,693.
Shares in crypto asset-focused companies also rose, with cryptocurrency exchange Coinbase (COIN) and MicroStrategy (MSTR) climbing by 7% and 12%, respectively.
The Dow Jones Industrial Average rose by 0.67%, the S&P 500 traded 1.1% higher, and the Nasdaq Composite advanced by 1.5%. Notably, both the S&P 500 and Nasdaq are looking to end a six-day losing streak.
Key economic indicators this week include GDP numbers, set for release on Thursday, and the Commerce Department's publication of March's personal consumption expenditures price index data on Friday. These could provide insight into the Fed's stance at their meeting from April 30 to May 1.
“If the GDP numbers coming out on Thursday are stronger than expected, it could result in increased investor confidence, possibly boosting investment in riskier assets like cryptocurrencies,” said Eli Taranto, CEO of EQI Bank, in an interview.
Conversely, weaker GDP data could lead to concerns about economic health, potentially causing investors to pull back from riskier assets, he said.
Key Level for Bitcoin
Popular trader and analyst Marco Johanning identified $66,700 as the "key level" for Bitcoin to flip to support going forward.
“Looking at the range, BTC reclaimed midrange and then sent from there,” he wrote in a post on X (formerly Twitter). “However, it couldn’t flip the next level at 66.7k so far. That’s the key level for today.”
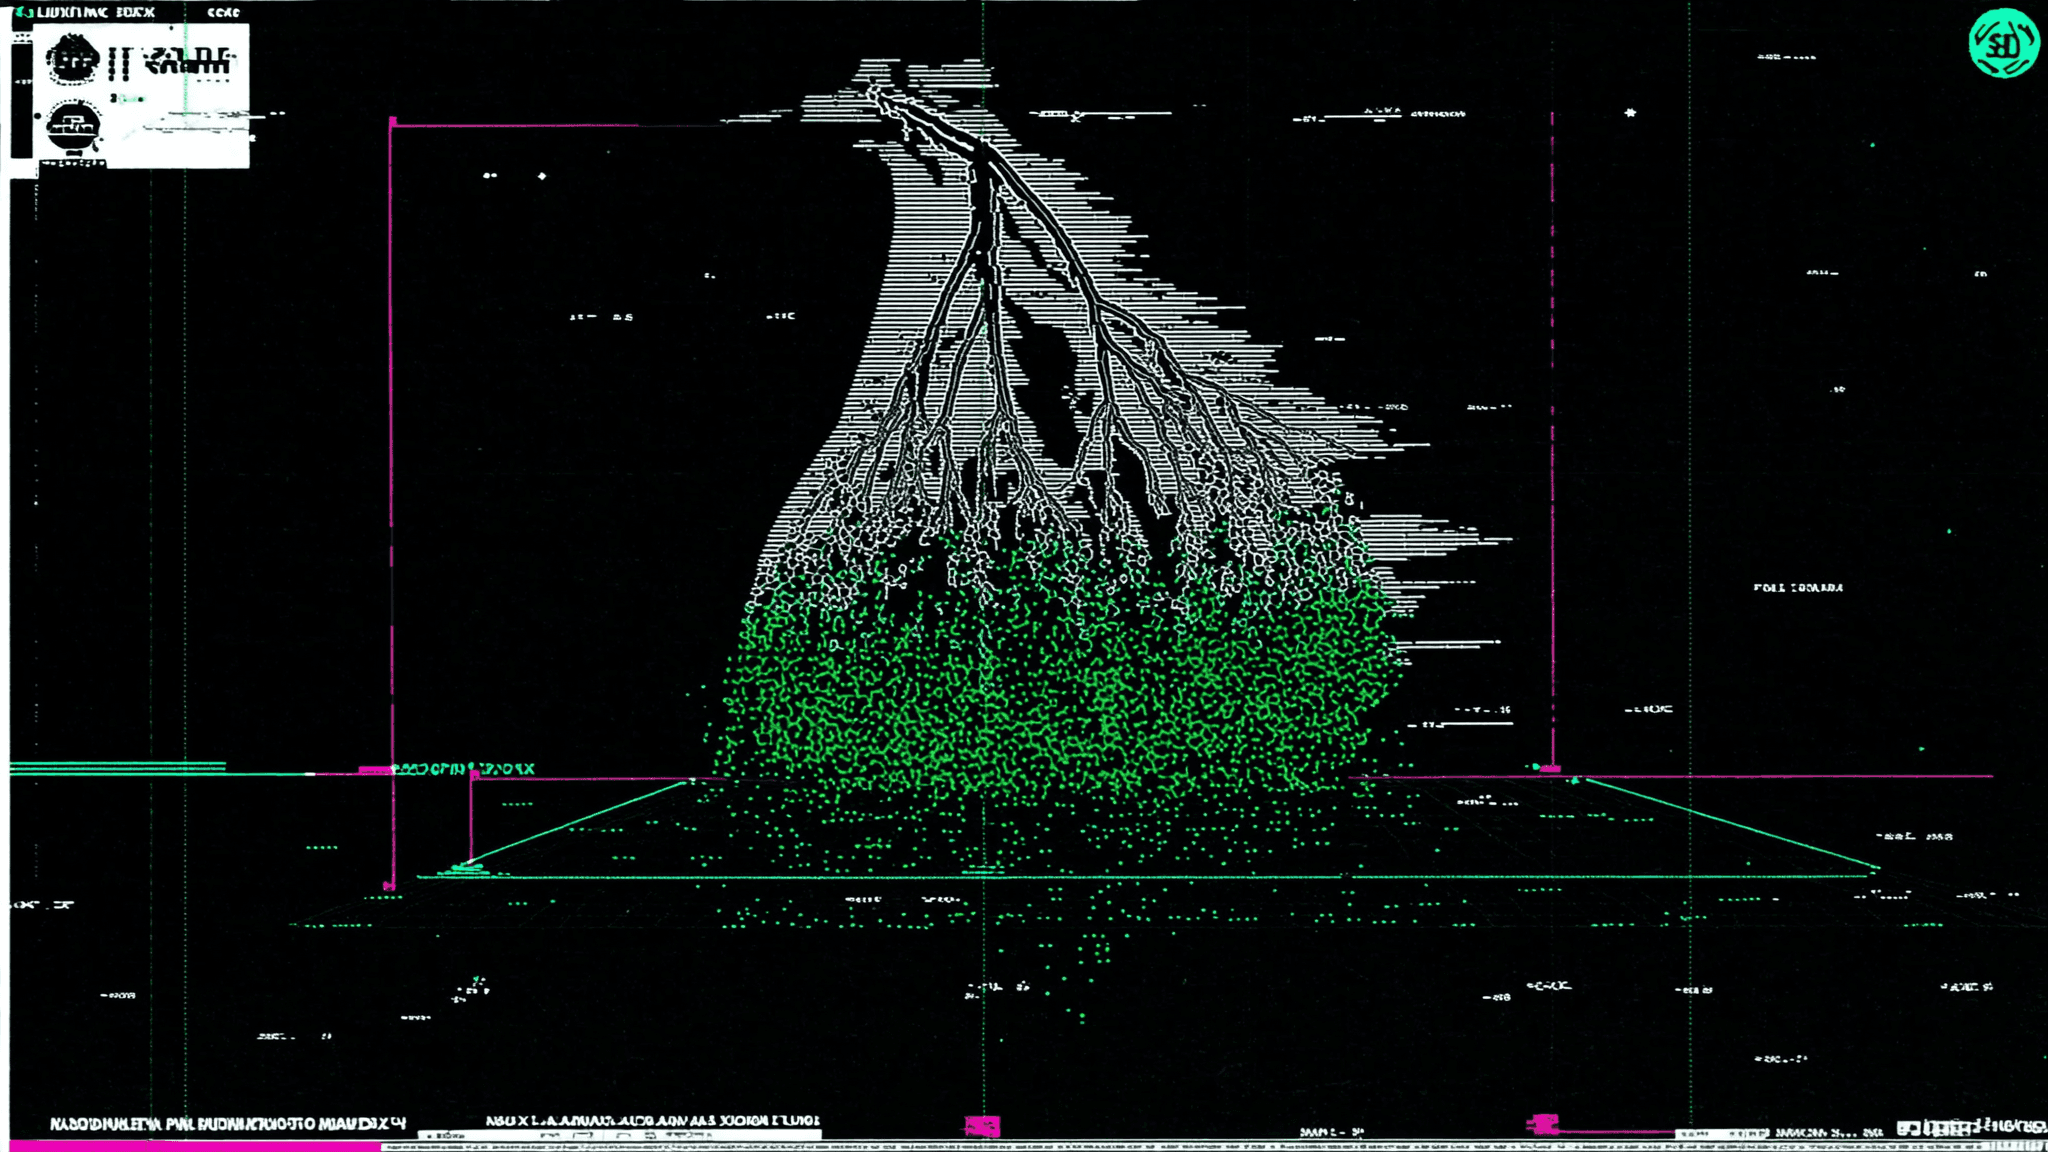
Meanwhile, trader and analyst Matthew Hyland noticed that Bollinger Bands — a tool used to predict Bitcoin's price movement — shows that there might be massive price momentum coming soon.
Bollinger Bands are a technical analysis tool developed by John Bollinger in the 1980s. They consist of three lines or 'bands' on a price chart that envelop the price movements of an asset.
When the Bollinger Bands contract or 'squeeze' — meaning the upper and lower bands move closer together — it suggests that the asset is experiencing low volatility and may be due for a period of higher volatility in the near term, which may result in a breakout in either direction.
According to the chart plotted by the analyst, Bollinger Bands look closer than they've been since mid-February, which was right before Bitcoin's price when it was under $50,000. This pattern suggests that Bitcoin might see another major price move.
Advertisement
Get an edge in Crypto with our free daily newsletter
Know what matters in Crypto and Web3 with The Defiant Daily newsletter, Mon to Fri
90k+ Defiers informed every day. Unsubscribe anytime.