Ether Turns Inflationary As On-chain Activity Slides

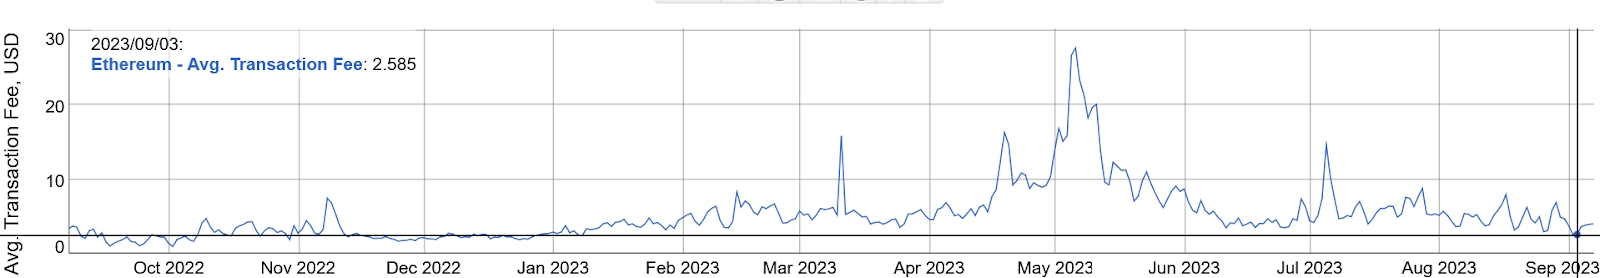
Ethereum’s on-chain activity receded this past week, with transaction fees dropping to an eight-month low.
Data from Bit Info Charts shows average transaction fees on Ethereum dipped to their lowest level since January last weekend, with users paying less than $2.60 for simple token transfers. Average gas fees were just 9 gwei at the time of writing.
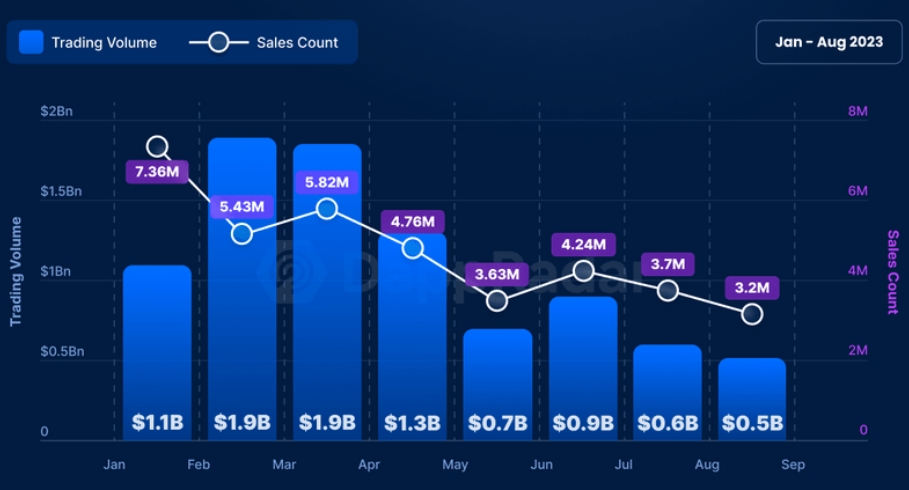
Ethereum’s falling transaction volume coincides with a deepening NFT bear market.
According to DappRadar, the value of combined monthly NFT trading across all networks is down 70% since March at $559M, while transaction volume is down 45% at 3.2M.
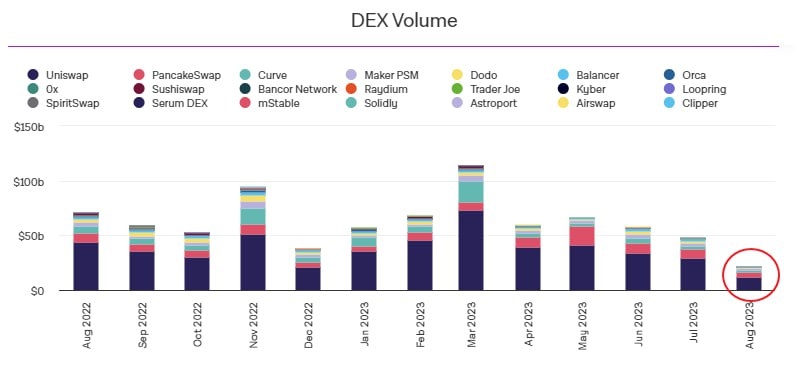
Spot trading volume on decentralized exchanges also dropped to its lowest level since December 2020 during August., according to data from The Block.
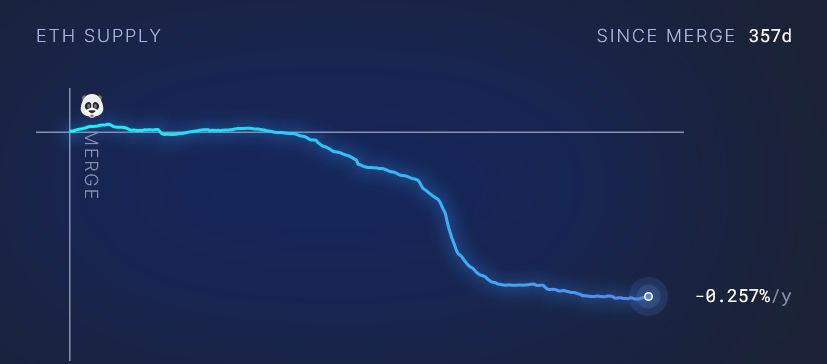
The slump in activity resulted in Ethereum’s burn rate flipping negative, with 3,750 ETH entering circulation since the Ether supply tagged a record low of 120.213M on Sept. 1, according to Ultra Sound Money.
Ethereum introduced a burn mechanism with the activation of EIP-1559 in August 2021, with ETH paid as base transaction fees permanently removed from circulation. With the rate of new Ether issuance falling approximately 90% following the network’s transition to Proof of Stake last September, the number of Ether in circulation was tipped to steadily fall.
ETH’s supply peaked at 120.53M in October 2022 and gradually fell to 120.43M by the end of April. The burn rate accelerated amid a frenzy of DEX-based memecoin trading, with 182,600 ETH – 60% of all Ether destroyed – removed from supply between April 18 and June 1.
However, activity has since plateaued, setting the stage for Ether’s supply to trend higher this past week.
Advertisement
Get an edge in Crypto with our free daily newsletter
Know what matters in Crypto and Web3 with The Defiant Daily newsletter, Mon to Fri
90k+ Defiers informed every day. Unsubscribe anytime.